Exploring The Rifts and Bonds Between International Relationships
Project Description
Exploring relationships between global countries through a network visualization. My final internship project for Interactive Things.
Published by
Interactive Things
Publish date
June 2019
Tools & Technologies
React, D3, R, Illustrator
Activities
Front-end web development, research, conceptualizing, page layout design, data analysis and visualization
Circle of Nations: Visualizing Relationships Between Countries
Created an interactive visualization during my internship at Interactive Things to map and explore relationships between nations, aiming to reveal patterns of connection and isolation in the global community through an engaging interface.
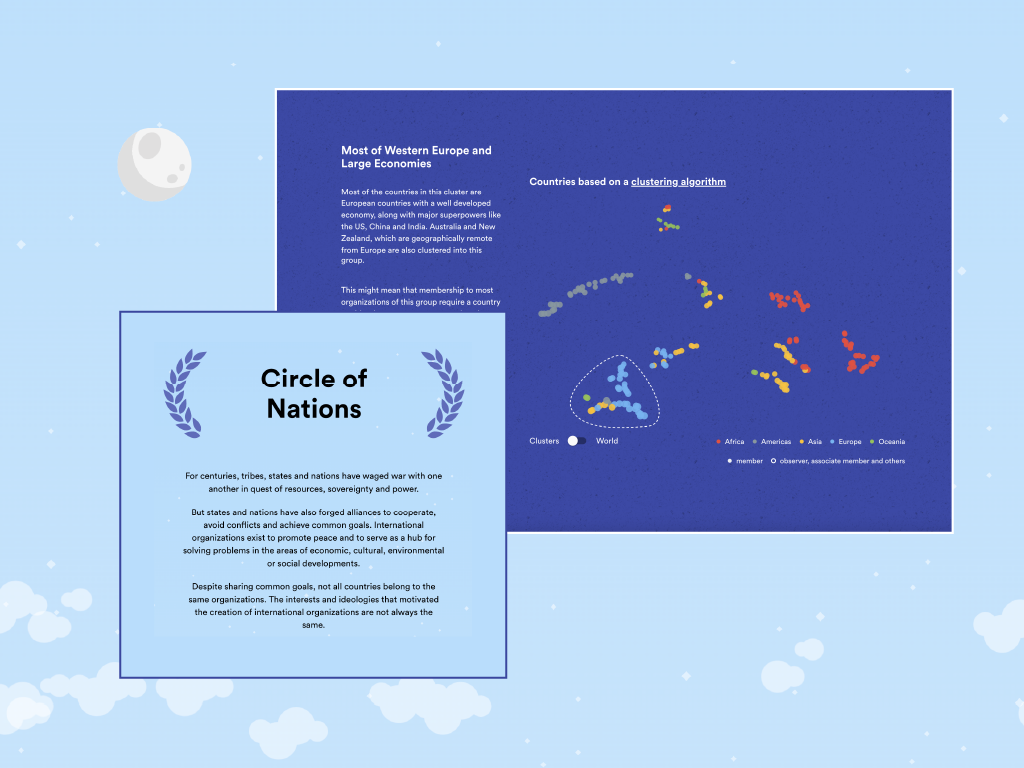
Leveraged data from the CIA World Factbook and employed T-SNE clustering analysis to process country relationships. The development journey involved extensive data exploration in R Studio, multiple visualization sketches including beeswarm-style approaches, and the creation of a scrollytelling interface that guides users through different relationship patterns.
Developed a comprehensive visualization tool that effectively displays complex international relationships through an intuitive user interface. The final design uses a carefully chosen blue color palette and Google Material design principles, allowing users to explore country connections through three main components: content cards, organization lists, and an interactive dot-based visualization.