Visualizing Tourism Trends in the Philippines
Project Description
An static data-driven report showcasing the state of tourism in the Philippines using publicly available data from 2014 to 2018.
Publish date
June 2019
Tools & Technologies
Observable Plot & Framework, React, Vite, R, Illustrator
Activities
Research, Data analysis and visualization, front-end web development
Visualizing Tourism Trends in the Philippines
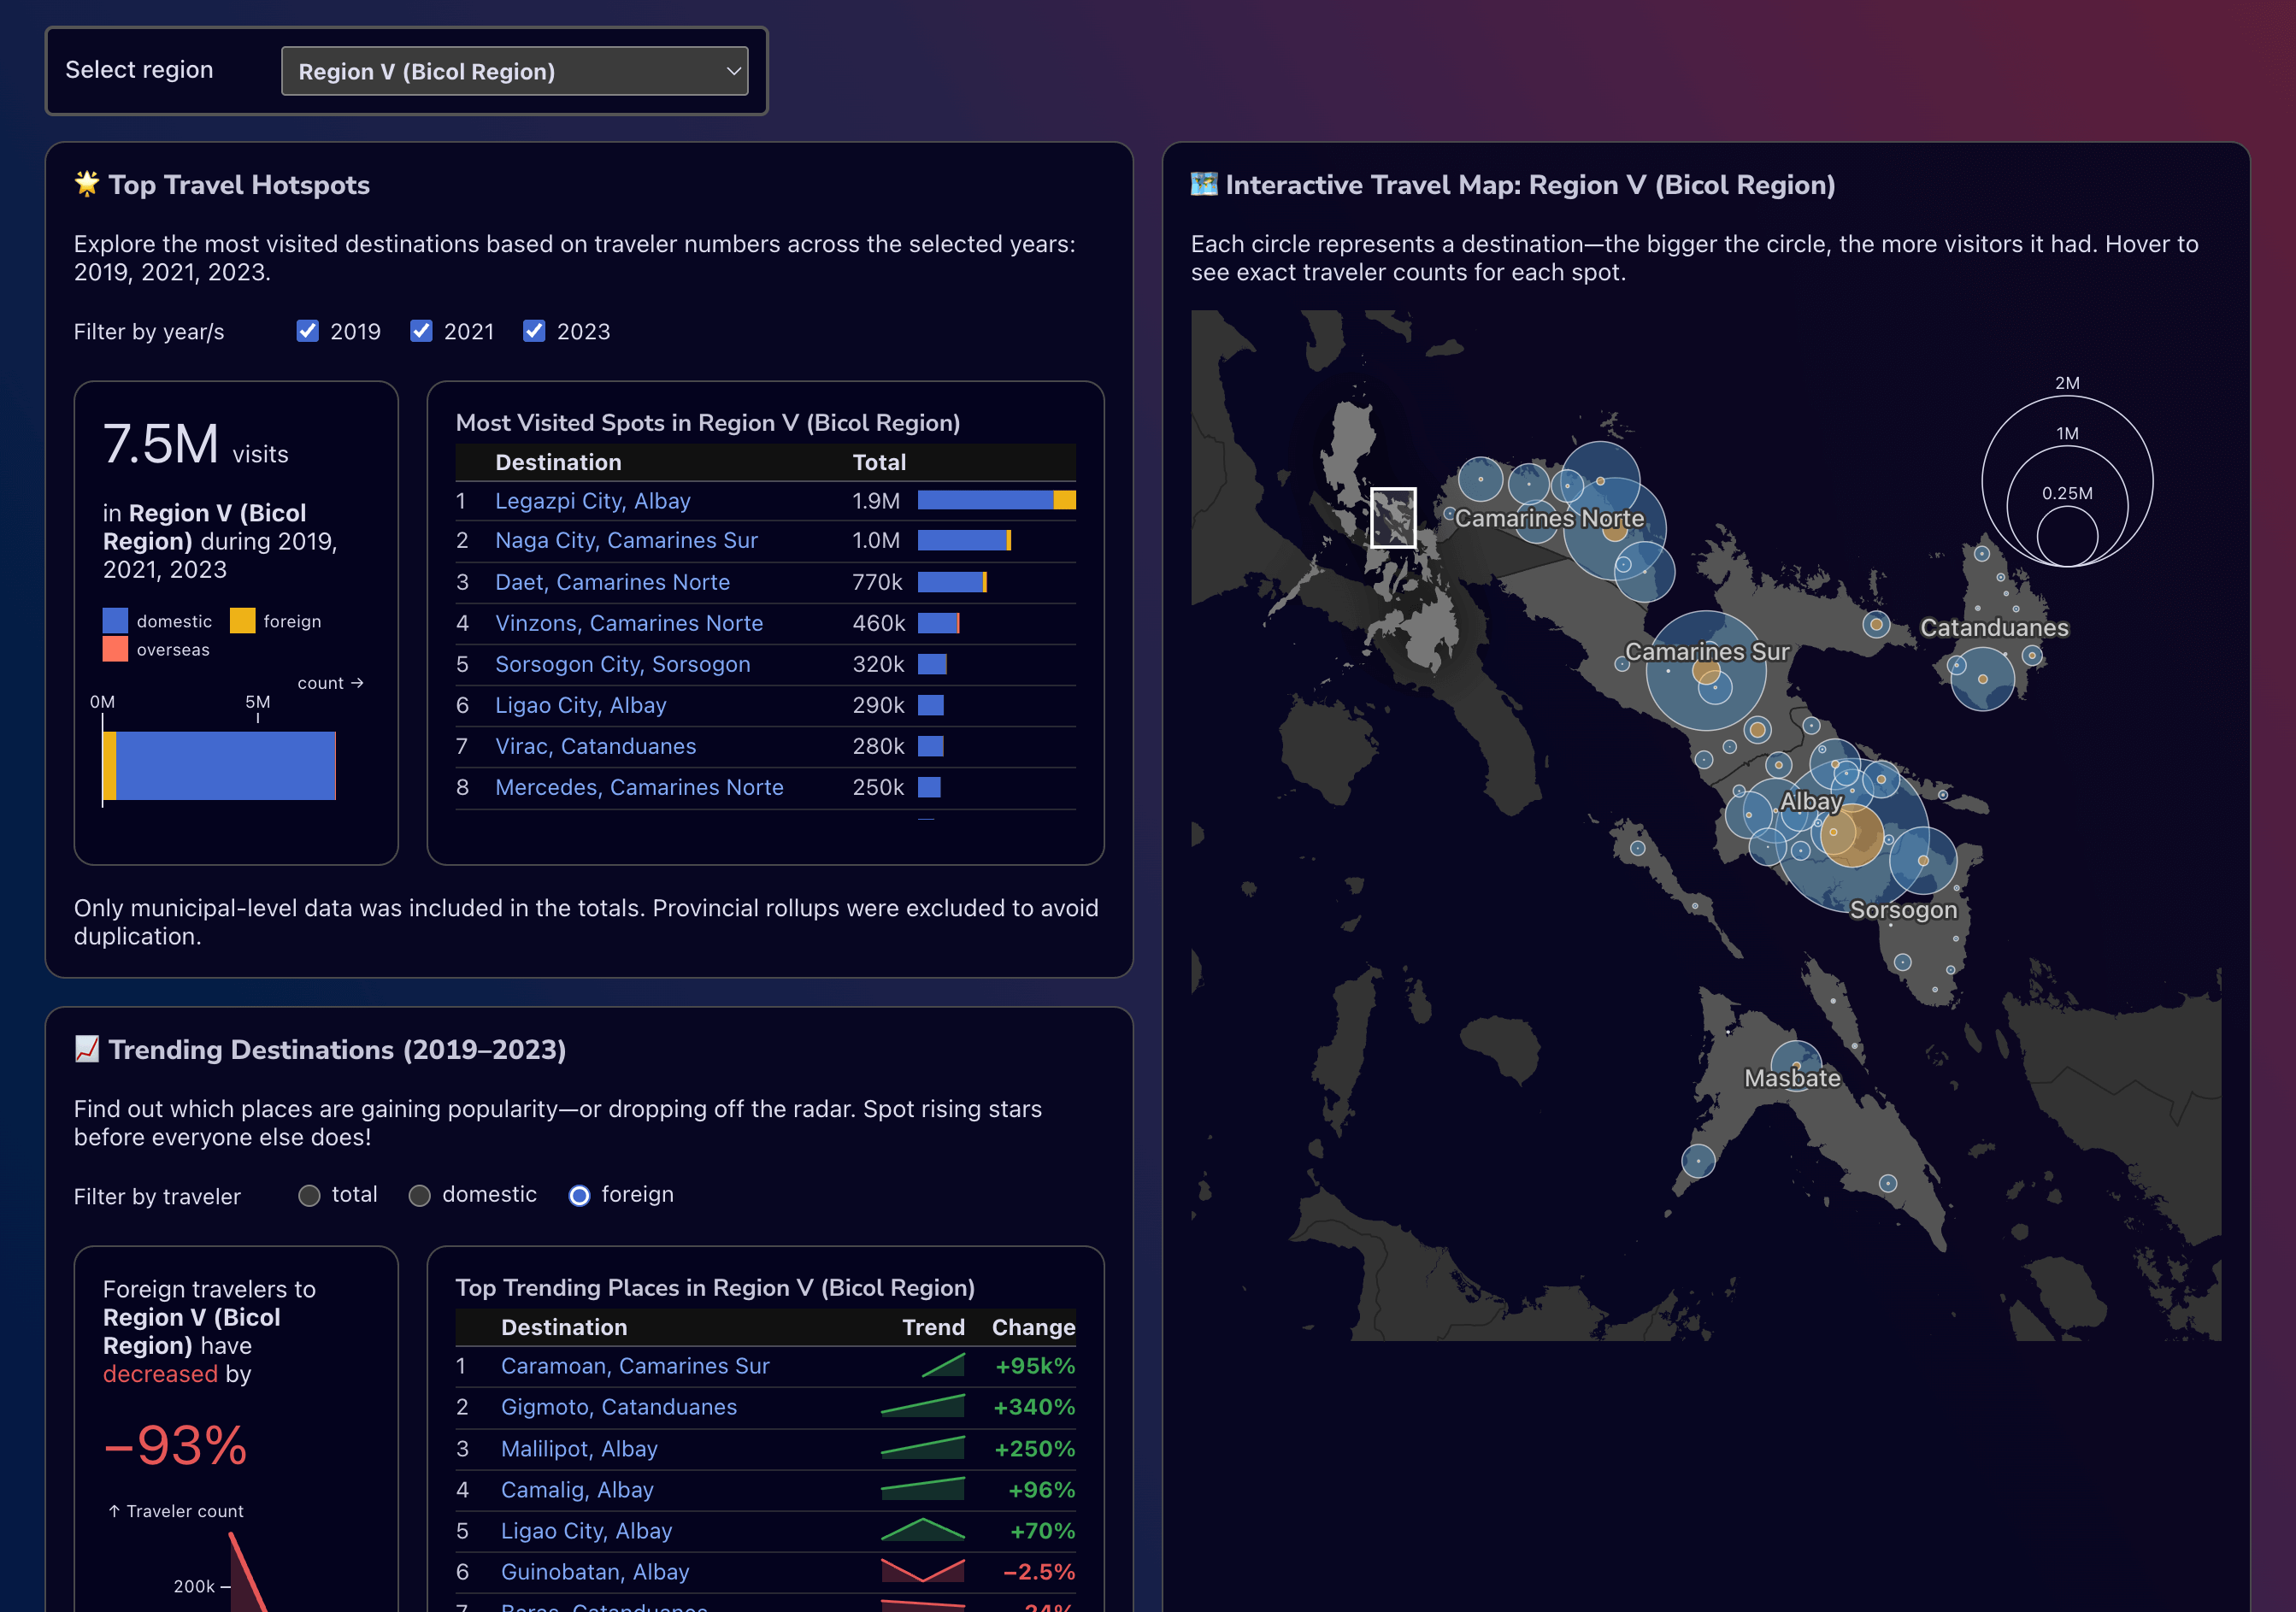
This project explores the state of tourism in the Philippines, now updated with data from 2014 to 2023. By extending the timeline, the visualization captures not only the steady growth leading up to 2019, but also the sharp declines during the pandemic years and the gradual recovery that followed.
The goal of this project is to provide a clear and intuitive view of how tourism patterns have shifted over the last decade, and which regions have experienced the most significant changes.
The visualizations are organized into three main parts: an overview of national tourism trends, a breakdown of foreign tourist origins, and a regional view of both domestic and international arrivals. Through line charts, bar graphs, and interactive maps, users can see how different regions — such as NCR, Region IV-A, and popular island destinations — have been affected differently over time.
By extending the data to 2023, the project offers a timely perspective on how the Philippine tourism landscape is evolving in the aftermath of global disruptions and what this might mean for the years ahead.