A Visual Explainer of Transboundary Haze in Southeast Asia
Project Description
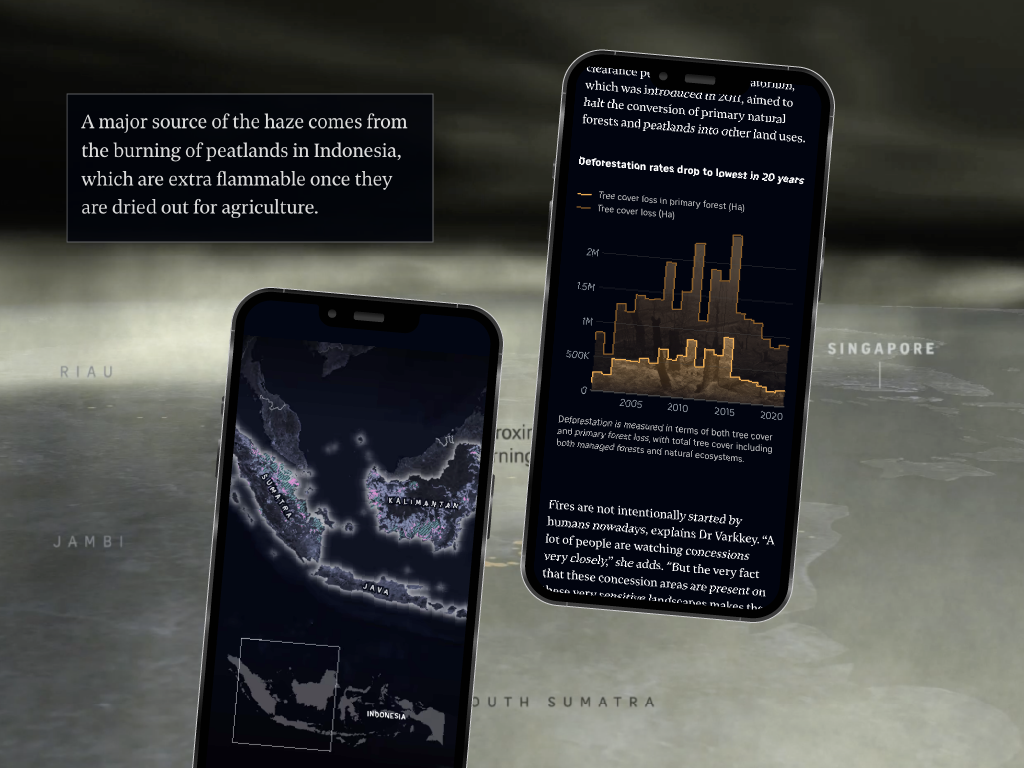
A visual explainer on why haze forms in Singapore and identifies the sources and entities primarily responsible for this phenomenon.
Published by
The Straits Times
Publish date
Oct 7, 2023
Collaborations with
Charlene Chua, Joseph Ricafort and Ryan Tan
Awards
4 Bronze from Society for News Design 2024: Environment & Science, Infographics - Regional/Local, Elements - Data visualization, Infographics - Environment & Science; Sigma Awards 2024 Shortlisted
Tools & Technologies
Vapor, Svelte, After Effects, R, Observable, QGIS, Illustrator
My Roles & Responsibilities
Conceptualizing, data analysis and visualization, layout design, video editing, and the development of specific interactive features.
Why the haze has reached Singapore’s shores again
This interactive story was initially pitched by our colleague Ryan Tan. We were tasked to examine the causes, origins and the hows and why it reached Singapore.
Solutions and Approach
Led by Charlene Chua, we explored multiple ways to visualize haze along with the guidance from our editor and Masters mentor Xaquin Gonzales-Veira, we attempted and pursued to use a new tool called Vapor which has the ability to visualize haze particles in the most visually sophisticated as possible.
Results & Impact
The datastory has gained a wider reach and positive feedbacks in social media especially on LinkedIn and Facebook. It gave people awareness and the ability to understand the haze situation in the clearest and visual way possible.
It also gained multiple recognitions from Society for News Design in 2024 within the categories of Environmental Science and Data Visualization.