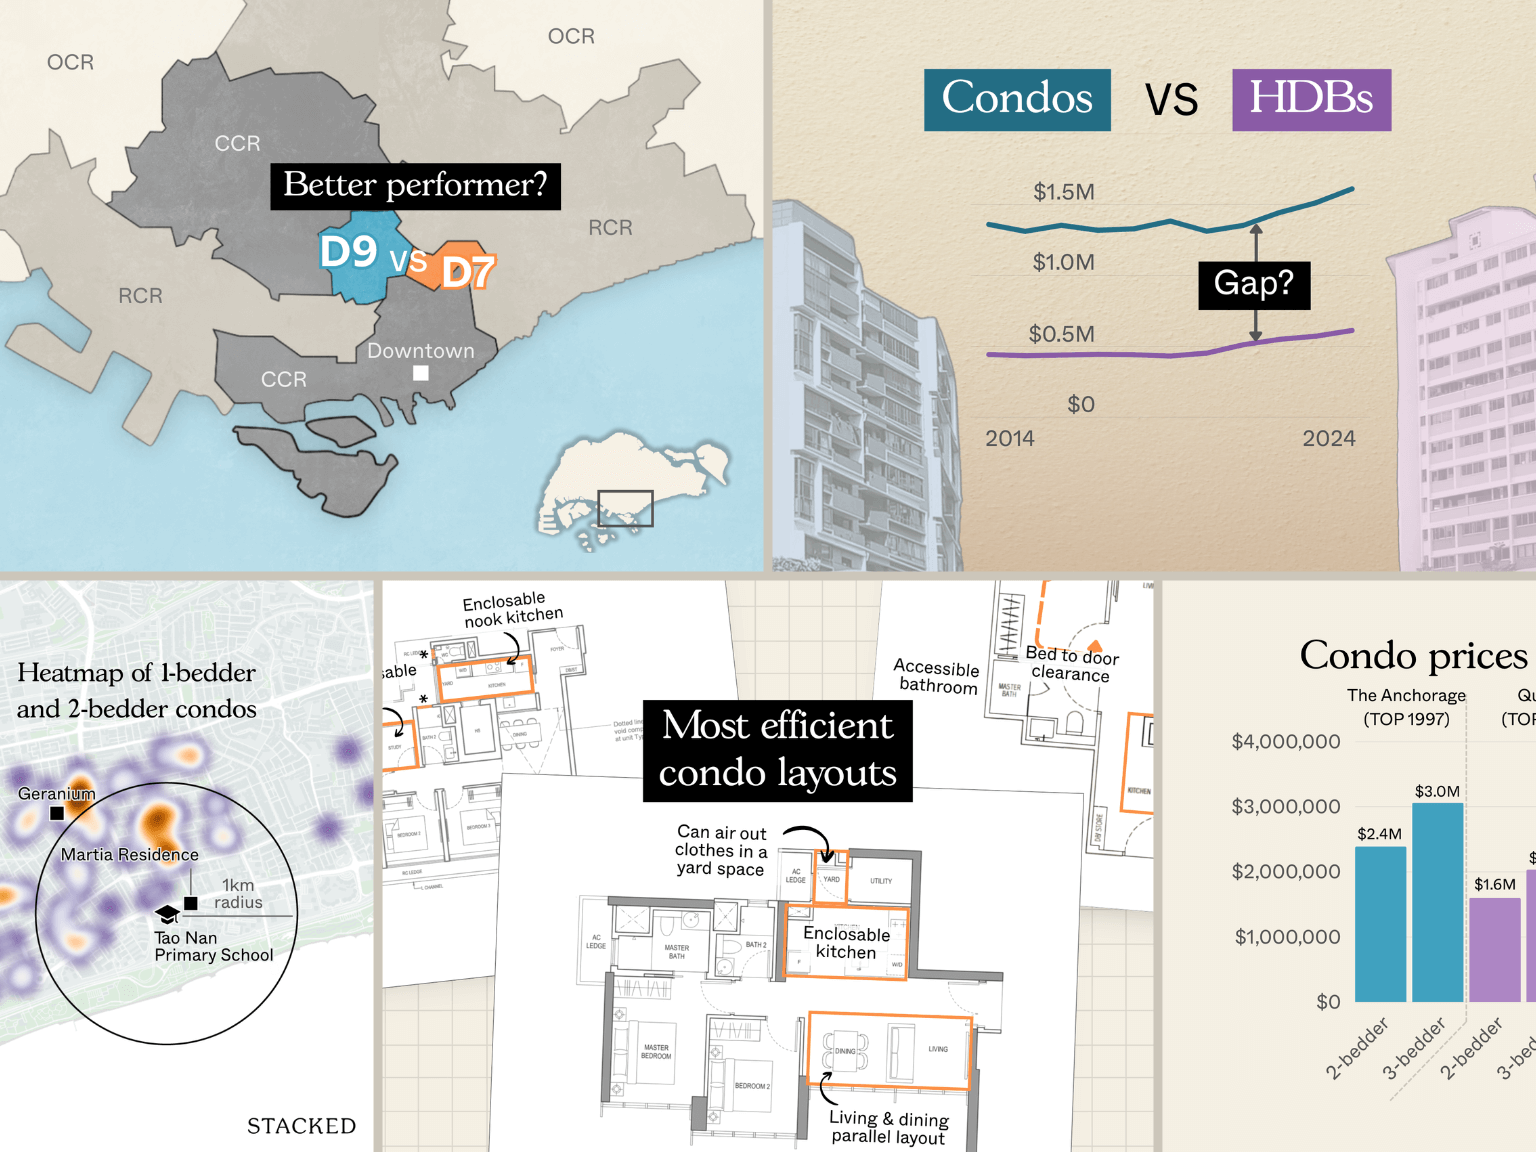
Getting Smarter with Stacked Graphics and Maps Creation Process
During my 2 month collab with Stacked (an independent voice in Singapore's real estate scene), we faced this challenge head on.
The challenge: Delivering high quality visuals on a tight turnaround.
What worked for us:
- Using the right tools. Canva gave us speed for charts, while Flourish helped us create specialized visuals.
- Focusing on the most important 20 percent of the work that delivered 80 percent of the impact.
- Adding refinements only if time allowed, but never at the cost of clarity.
The result:
- More than 240 graphics produced across 27 articles
- A cohesive and consistent style for charts, maps, and feature images that sticks to the brand
- Faster turnaround without sacrificing quality