Picking a Home Blind
Buying or renting a home in Singapore means staring at a floor plan, a price, and a pin on a map — then guessing at everything the listing doesn't tell you. How far is the MRT, really, on foot, at 8am? Is there anywhere to eat breakfast nearby? Is this a 15-minute errand or a 40-minute one?
That gap between what a listing shows and what daily life actually costs is where bad decisions get made. People pick a unit that looks right on paper and discover the tradeoff three months into the lease — by which point it's an expensive mistake to undo.
I made that mistake myself. The fix wasn't a better checklist. It was giving people a way to see the tradeoff before they sign, not after.
One Score, Not Eleven Tabs
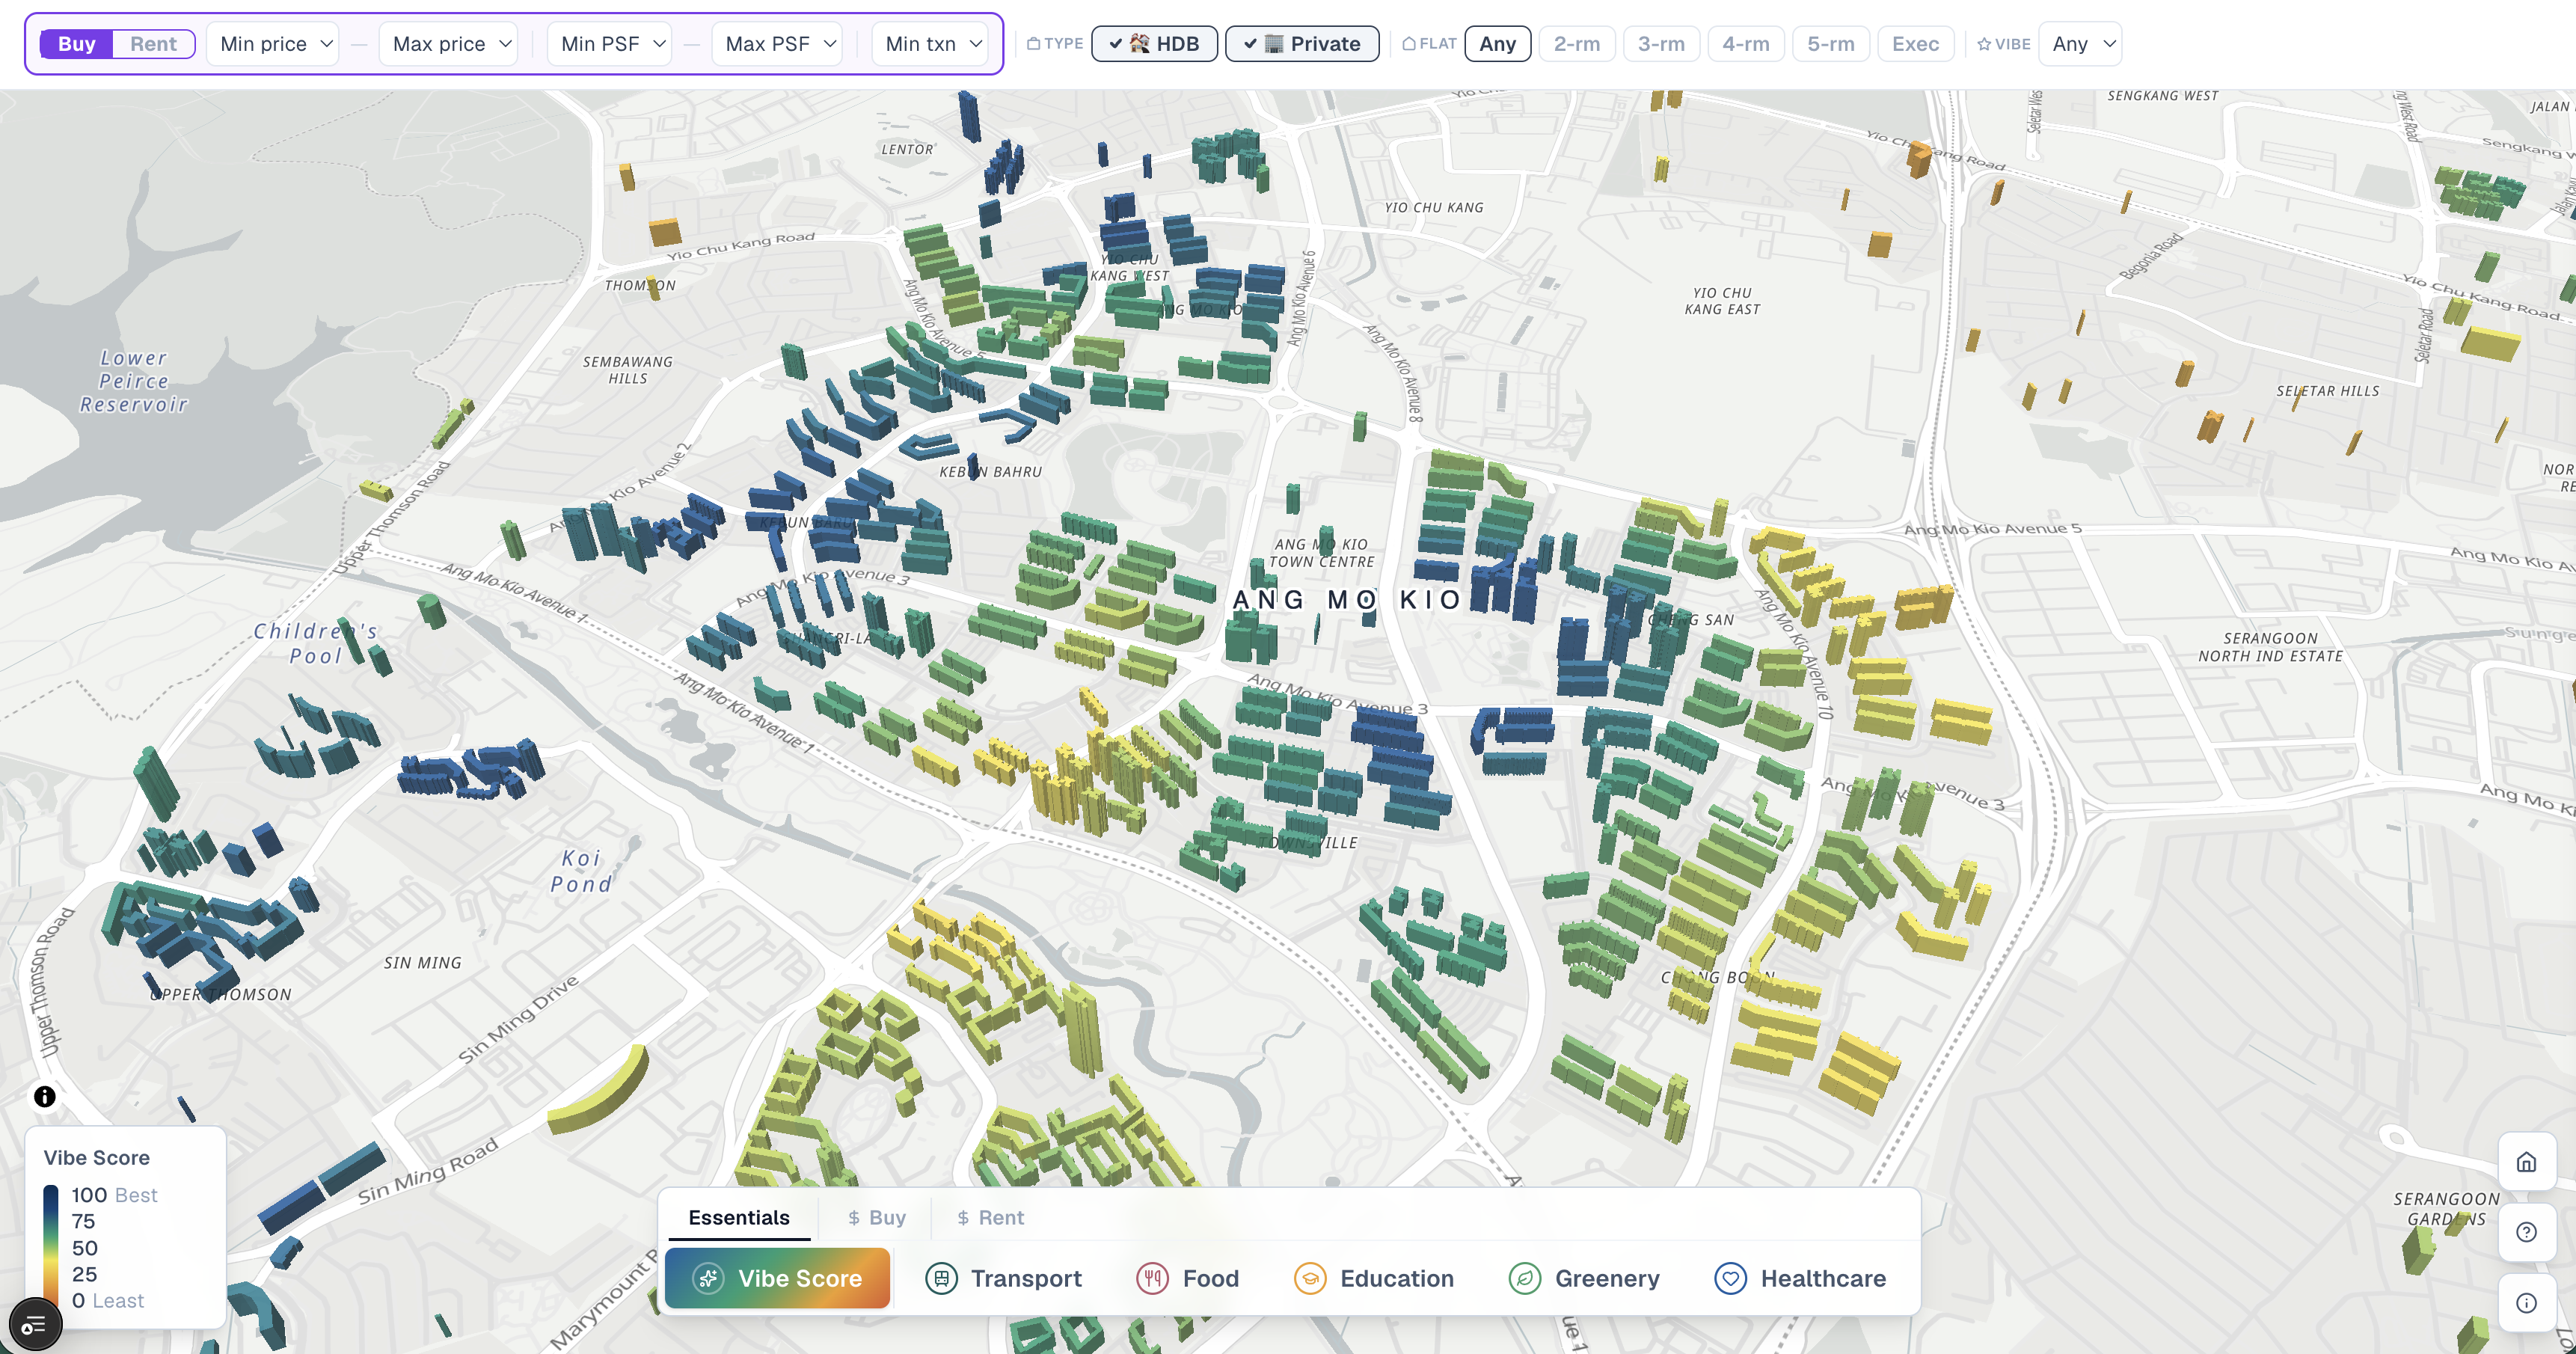
VibeHood is a 3D map of every residential building in Singapore, scored against what actually matters for how someone lives — not a generic walkability index, but a profile-weighted Vibe Score across seven pillars: transport, food, education, greenery, healthcare, tranquility, and lifestyle.
Pick a profile — young family, young professional, sandwich generation, empty nester — and the weighting shifts with it. A family's score leans on schools and childcare. A young professional's leans on transport and food. The map recolours in real time, so instead of reading eleven tabs of criteria, you see the answer rendered on the building itself.
Layered underneath is real transaction data — HDB resale, private sale PSF, and rental rates — pulled directly from Singapore government sources. Filter by budget and flat type, hover a building, and you get median price, transaction volume, and 24-month trend, next to the lifestyle fit. One view, one decision, instead of a spreadsheet in one tab and a map in another.
The hard part was never the 3D map. It was collapsing five disconnected, inconsistent sources into one number someone can act on without reading a manual first.
16,282 Buildings, Three Datasets, One Person
- 16,282 buildings scored and rendered at street level, block by block — not a sample, the full national dataset.
- 3 government datasets (HDB resale, URA private transactions, URA rental) reconciled into a single pipeline, despite inconsistent address formats and historical planning-boundary quirks that would silently break a naive join.
- 4 lifestyle profiles, each independently weighted, so the same map tells a different, correct story to a family versus a single professional.
- Sub-second render of the entire national building set in-browser, via PMTiles served from Cloudflare R2 — no tile server, no loading spinner between filter changes.
- Solo build, shipped: product design, UX, data pipeline, and full-stack development — idea to live product, one person.
Data Nobody Uses Is Data That Doesn't Exist
Most valuable data never gets used, because it sits in a spreadsheet or a static dashboard that nobody downstream actually trusts enough to act on. VibeHood is what it looks like when that gap gets closed — fragmented, authoritative data turned into something a non-expert can filter, trust, and decide from in minutes.
For the technical build breakdown — architecture, data pipeline, and MapLibre implementation — see How I Built VibeHood.
 Connect on LinkedIn